Understanding Live Crypto Candle Charts: A Beginner's Guide
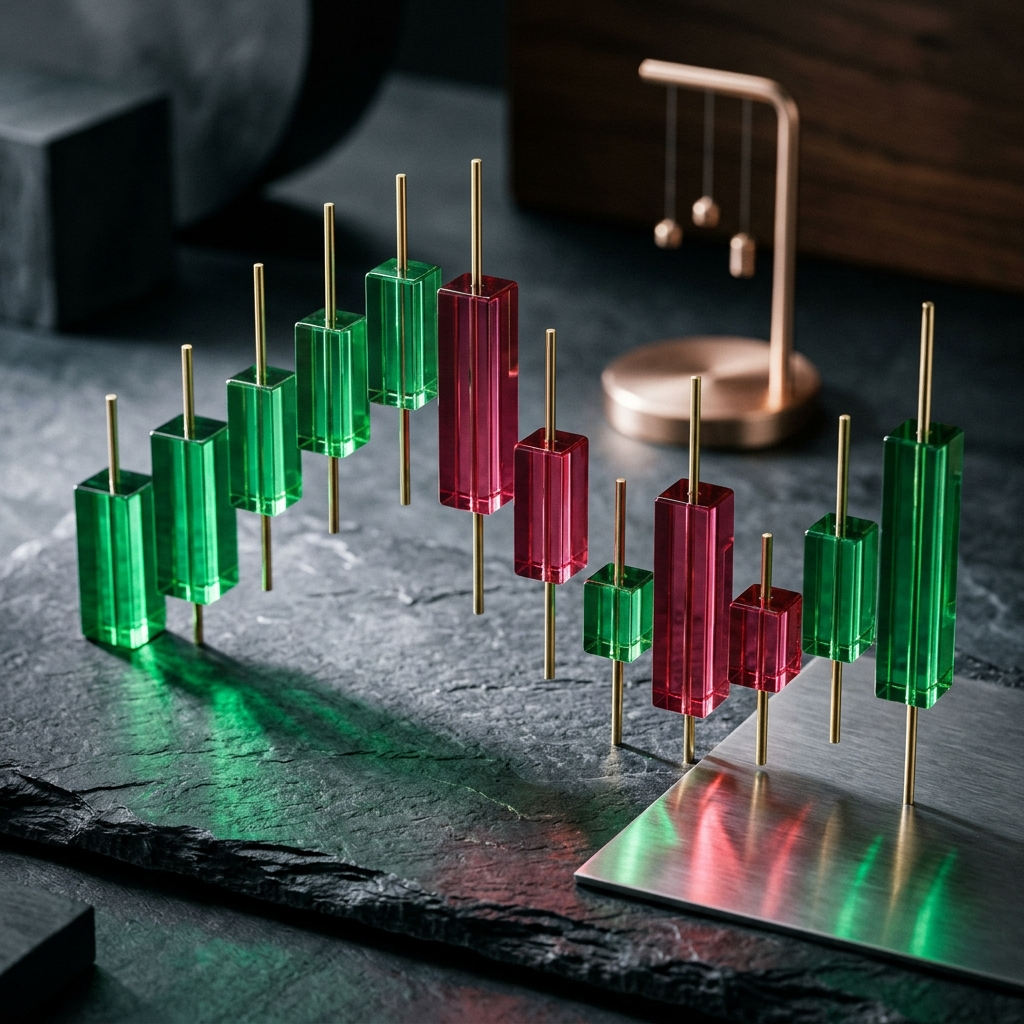
A live cryptocurrency candlestick chart displays price movement across set intervals, showing the open, high, low, and close values for each period. By condensing these four data points into a single bar, candlestick charts allow market watchers to evaluate momentum, volatility, and price direction without sifting through raw transaction logs.
The Core Anatomy of a Candlestick
Every candlestick represents trading activity over a selected timeframe, such as one minute, one hour, or one day. The wide rectangular section is the body, while the thin vertical lines extending above and below are the wicks (or shadows).
The edges of the body mark the opening and closing prices for the interval. If the closing price is higher than the opening price, the body represents net upward movement and is typically displayed in green or hollow. If the asset closes lower than it opened, the body indicates net downward movement and is traditionally colored red or solid black.
The wicks capture the complete price range of the period. The top of the upper wick marks the highest recorded price, while the bottom of the lower wick reflects the lowest recorded price. When an asset experiences significant price swings but closes near its opening value, the candle shows long wicks and a narrow body, reflecting active price discovery.
- Body: The range between the opening and closing prices.
- Upper Wick: The highest traded price reached during the interval.
- Lower Wick: The lowest traded price reached during the interval.
- Color / Fill: Indicates whether the period closed higher (bullish) or lower (bearish) than it opened.
Takeaway: Candlesticks organize period price swings into open, high, low, and close values.
Reading Market Sentiment Through Candle Shapes
Candlestick shapes reflect the balance between buying and selling pressure across an interval. Standard single-candle formations provide insight into market dynamics before the period closed.
A long body with short wicks reflects clear directional movement. When buyers advance prices steadily from open to close, upward volume controls the interval. Conversely, a tall red body reflects sustained selling pressure throughout the period.
When a candlestick shows a small body centered between long wicks—often called a doji—neither buyers nor sellers established control. The market traded across a wide range but closed near its starting price. This pattern reflects indecision and often appears when an ongoing trend begins to stall.
Hammer formations have a small body near the top of the range with a long lower wick. This structure indicates that sellers pushed prices down significantly during the period, but buyers entered the market and pushed the closing price back near the open.
- Long Body: Indicates sustained, directional momentum during the timeframe.
- Doji: Reflects balance and indecision between buyers and sellers.
- Extended Lower Wick: Indicates buyers pushed price back up from period lows.
- Extended Upper Wick: Indicates sellers pushed price back down from period highs.
Takeaway: Comparing the size of the candle body to its wicks shows whether buyers or sellers drove the final price.
Selecting Timeframes for Real-Time Analysis
Candlestick charts are most practical when matched to your tracking objectives. Live crypto charts allow users to change intervals based on how quickly market data needs to be assessed.
Short timeframes, such as 1-minute, 5-minute, or 15-minute charts, update rapidly to show immediate price reactions. While useful for monitoring sudden market activity, short intervals contain substantial market noise, where small trade volumes can skew individual candles.
Longer timeframes, including 4-hour, daily, and weekly charts, filter out short-term fluctuations to reveal prevailing price trends. For major assets like Bitcoin and Ethereum, higher-timeframe charts offer clearer reference points for key support and resistance levels.
- Short Intervals (1m to 15m): Best for tracking immediate price fluctuations and short-term volatility.
- Intermediate Intervals (1h to 4h): Useful for intraday trend assessment and broader price patterns.
- Long Intervals (Daily/Weekly): Useful for identifying overall market direction while filtering out short-term noise.
Takeaway: Higher timeframes highlight broader trends, while shorter intervals capture immediate price movements.
Identifying Basic Support and Resistance on Live Charts
Candlestick charts help users identify key price levels known as support and resistance. These levels mark price ranges where market movement frequently pauses or changes direction.
Support forms at price levels where downward movement repeatedly halts. On a chart, this appears when multiple candlesticks form lower wicks near the same horizontal level, indicating that buyers are entering the market and absorbing available supply.
Resistance forms at price ceilings where upward movement stalls. Here, consecutive candles fail to close above a specific price, often leaving distinct upper wicks. Observers monitor resistance to determine whether price momentum is sufficient to establish a higher range.
- Horizontal Support: A recurring price floor where buying interest halts downward price movement.
- Horizontal Resistance: A recurring price ceiling where selling pressure halts upward price movement.
- Breakout Confirmation: Occurs when a candlestick closes clearly beyond an established support or resistance level.
Takeaway: Support and resistance levels highlight structural price zones where market activity regularly shifts.
A Step-by-Step Routine for Reading Live Charts
Using a structured observation routine helps prevent hasty interpretations of short-term price swings. Beginners can follow a consistent process when reviewing live market data.
- Check the Broader Trend: Review the daily or 4-hour chart to determine if the asset is trending upward, downward, or consolidating.
- Identify Key Price Boundaries: Note established support and resistance levels where recent reversals occurred.
- Switch to the Operational Timeframe: Move to an intermediate view, such as the 1-hour or 15-minute chart, to evaluate current price action relative to the larger trend.
- Evaluate Recent Candlestick Formations: Observe whether recent candles show large bodies reflecting clear direction or long wicks reflecting price rejection.
- Review Related Market Context: Check chart observations alongside real-time price alerts and up-to-date blockchain news before reaching a conclusion.
Takeaway: Moving from higher to lower timeframes provides essential context before interpreting individual live candles.
Integrating Live Chart Reading with Market Tracking Tools
Reading live candlestick charts is most effective when supported by tracking tools. Because cryptocurrency markets operate continuously, monitoring charts manually around the clock is neither necessary nor practical.
Tracking tools like Crypto Pulse let you view detailed charts for Bitcoin, Ethereum, and other major cryptocurrencies alongside your account data. Setting instant price alerts notifies you when an asset approaches predetermined support or resistance levels, eliminating the need to watch every candle close in real time.
Pairing chart literacy with price alerts and current blockchain news allows you to track market developments systematically and respond to price movements when key thresholds are reached.
Takeaway: Combining candlestick analysis with automated price alerts ensures you track key market levels without constant screen monitoring.
Frequently Asked Questions
The body of a candlestick represents the price range between the open and close of that specific timeframe. The wicks (or shadows) show the highest and lowest prices reached during that interval.
A green (or hollow) candlestick indicates that the price closed higher than it opened during that period. A red (or solid) candlestick indicates that the price closed lower than it opened.
Beginners generally benefit from starting with higher timeframes, such as the 4-hour or daily charts, to identify the broader market trend with less short-term price noise.
Support and resistance levels appear where multiple candlesticks consistently test and reverse from specific price levels, often visible through recurring upper or lower wicks at a consistent price boundary.